Insightful Details on International Trade

FACTS & FIGURES

Global Merchandise Trade

Since 2000, global merchandise exports have shown a consistent upward trend, with only a few exceptions. The most recent decline occurred in 2020, attributed to the global COVID-19 pandemic. However, exports have rebounded strongly since then, as illustrated in the following figure:

Trade in the EU

The European Union accounts for approximately 14% of global trade in goods. In 2023, while imports decreased compared to 2022 due to falling energy prices, exports remained stable. Germany held the largest share of extra-EU trade in 2023, contributing 28% of the EU’s exports of goods to non-EU countries. Italy, the Netherlands, and France followed as the next three largest exporters.

EU Export Products

Trade within the European Union spans various sectors and product categories. The majority of EU exports are concentrated in machinery and transport equipment, manufactured goods, and chemicals and related products.

Statistic: Annual total goods exports of the European Union from 2002 to 2022, by product category (in million euros) | Statista
Find more statistics at Statista

EU Trade Partners

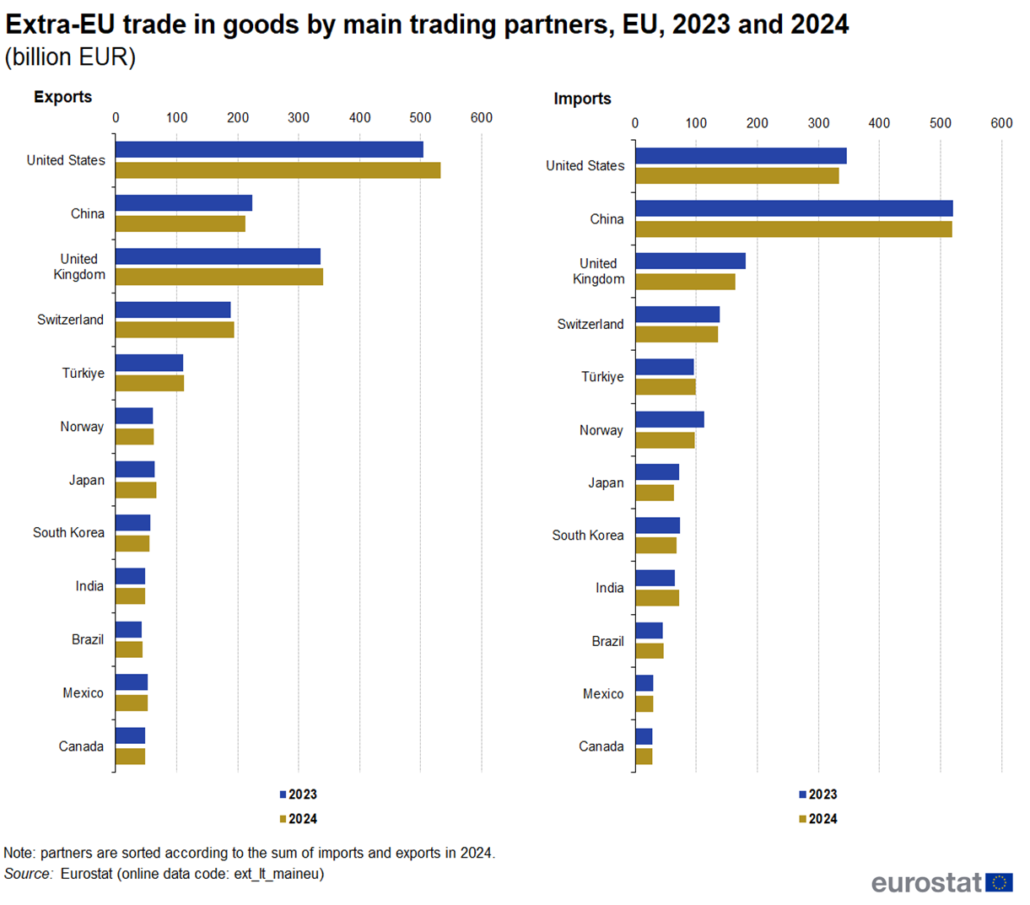
The EU’s main trading partners remained consistent in 2023 and 2024, with only minor fluctuations in their respective shares.